
How to Simulate PageSpeed Insights with Lighthouse

Have you ever been unable to use PageSpeed Insights to test your sites when working with local builds or basic authentication protections, such as with WPEngine’s transferable sites and other protected environments? This limitation requires a solution that lets you approximate PageSpeed Insights’ results with a tool that can access protected environments.
Not being able to test performance, SEO, accessibility, and best practices hinders your ability to optimize and monitor your site effectively during development.
To address this, we’ve developed a solution using Google’s open-source tool, Lighthouse, to perform detailed local performance audits under conditions similar to PageSpeed Insights.
With the help of Node.js and Express, we’ll use Lighthouse to approximate the audits provided by PageSpeed Insights and help you optimize your site’s performance at every step of development.
Why Do We Need Local Performance Testing Solutions?
Using Lighthouse locally allows developers to customize the testing environment to their specific needs, which includes handling URLs protected by basic authentication features. Since PageSpeed Insights can’t audit protected sites, developers who want to optimize performance pre-launch need to come up with a local solution that provides similar benefits.
How to Set Up a Local Testing Environment with Node.js and Express
Our solution involves setting up a Node.js server using Express to manage performance testing requests.
This setup lets you approximate the results you would get from PageSpeed Insights and offers the flexibility to handle scenarios that the online tool or browser lighthouse does not support directly.
Step 1: Install Node.js and Required Packages
Ensure you have Node.js installed on your system. Then, create a new directory for your project and install the necessary packages:
mkdir lighthouse-server
cd lighthouse-server
npm init -y
npm install express lighthouse chrome-launcher
Step 2: Set Up the Express Server
Create a file named server.js and set up your Express server with the following code:
const express = require('express');
const fs = require('fs');
const { v4: uuidv4 } = require('uuid');
const path = require('path');

const PORT = 3000;
let lighthouse;
let chromeLauncher;

(async () => {
    lighthouse = (await import('lighthouse')).default;
    chromeLauncher = await import('chrome-launcher');
})();

const app = express();
app.use(express.json());

const resultsDirectory = path.join(__dirname, 'results');
if (!fs.existsSync(resultsDirectory)){
    fs.mkdirSync(resultsDirectory, { recursive: true });
}

const getSafeFilename = (url) => {
    return encodeURIComponent(url).replace(/[%]/g, '');
}

const loadHistory = (url) => {
    const filePath = path.join(resultsDirectory, `${getSafeFilename(url)}.json`);
    if (fs.existsSync(filePath)) {
        return JSON.parse(fs.readFileSync(filePath, 'utf8'));
    }
    return [];
};

const saveHistory = (url, data) => {
    const filePath = path.join(resultsDirectory, `${getSafeFilename(url)}.json`);
    fs.writeFileSync(filePath, JSON.stringify(data, null, 2));
};

const runLighthouse = async (url, config, outputFilename) => {
    const chrome = await chromeLauncher.launch({chromeFlags: ['--headless']});
    const options = {
        logLevel: 'info',
        output: 'html',
        onlyCategories: ['performance', 'accessibility', 'best-practices', 'seo'],
        port: chrome.port,
        ...config,
    };

    try {
        const runnerResult = await lighthouse(url, options);
        fs.writeFileSync(outputFilename, runnerResult.report);
        return {
            scores: {
                performance: runnerResult.lhr.categories.performance.score * 100,
                accessibility: runnerResult.lhr.categories.accessibility.score * 100,
                bestPractices: runnerResult.lhr.categories['best-practices'].score * 100,
                seo: runnerResult.lhr.categories.seo.score * 100
            },
            reportPath: outputFilename
        };
    } finally {
        await chrome.kill();
    }
};

app.post('/pagespeed-test', async (req, res) => {
    const { url } = req.body;
    if (!url) {
        return res.status(400).json({ error: 'URL is required' });
    }

    const id = uuidv4();
    const mobileConfig = {
        throttling: {
            rttMs: 150, // round-trip time in milliseconds
            throughputKbps: 1638.4, // throughput in kilobits per second
            cpuSlowdownMultiplier: 4 // how much slower the CPU is assumed to be
        },
        emulatedFormFactor: 'mobile',
        channel: 'cli'
    };

    const desktopConfig = {
        throttling: {
            rttMs: 40, // round-trip time in milliseconds
            throughputKbps: 5000, // throughput in kilobits per second
            cpuSlowdownMultiplier: 1 // no slowdown
        },
        emulatedFormFactor: 'desktop',
        channel: 'cli'
    };

    try {
        const mobileResults = await runLighthouse(url, mobileConfig, `reports/${id}_mobile.html`);
        const desktopResults = await runLighthouse(url, desktopConfig, `reports/${id}_desktop.html`);

        const result = {
            url,
            timestamp: new Date().toISOString(),
            mobile: {
                scores: mobileResults.scores,
                reportUrl: `http://localhost:${PORT}/reports/${id}_mobile.html`
            },
            desktop: {
                scores: desktopResults.scores,
                reportUrl: `http://localhost:${PORT}/reports/${id}_desktop.html`
            }
        };

        // Load existing history without adding the current result
        const history = loadHistory(url);

        // Add current test result to history for future requests
        const updatedHistory = [...history, result];
        saveHistory(url, updatedHistory);

        // Return the current result and history (excluding current test)
        res.json({
            currentResult: result,
            history: history
        });
    } catch (error) {
        res.status(500).json({ error: 'Failed to run Lighthouse tests' });
    }
});

app.use('/reports', express.static('reports'));
app.listen(PORT, () => {
    console.log(`Server running on <http://localhost>:${PORT}`);
});
Settings
Mobile Settings
Throttling. Mobile tests are set up with significant throttling on the network and CPU. Deliberate throttling simulates the conditions of a mobile device accessing the site over a typical 3G or 4G network, which is slower than most wired or Wi-Fi connections.
Throttling includes:
- RTT (Round Trip Time). Increased latency to mimic network conditions.
- Throughput. Limited bandwidth to reflect the slower mobile networks.
- CPU Slowdown. Simulates the slower processing power of mobile devices compared to desktops.
Emulated Form Factor. The test is conducted in an emulated mobile environment. This means the site is tested as it would appear on a mobile device, considering factors like screen size, touch interfaces, and mobile browsers.
Desktop Settings
Throttling. The throttling settings for desktop are less severe than mobile because desktop devices generally have faster and more reliable network connections and more powerful CPUs. Throttling for desktop might include:
- Minimal RTT. Represents the lower latency typically experienced on desktop.
- Higher Throughput. Reflects the faster internet connections available to desktop devices.
Emulated Form Factor. No mobile emulation. We test the site as it would appear on a desktop browser, using the full-screen real estate and assuming input methods like a mouse and keyboard.
Why Are We Using These Settings?
The rationale behind these specific settings is to mirror as closely as possible the average user’s experience on each type of device. By emulating slower, more constrained mobile environments, you can understand how the site will perform under the most common mobile conditions.
On the other hand, testing with desktop settings allows for assessment under optimal conditions with faster CPUs and network speeds.
This approach helps identify potential bottlenecks and performance issues that might not be apparent in one environment but are critical in another. For instance, heavy images and scripts that load without issue on a fast desktop connection might cause significant delays on a mobile network.
Step 3: Running and Testing Your Server
Run your server using:
node server.js
Test the functionality by sending a POST request to http://localhost:3000/pagespeed-test with a JSON body containing a URL with basic authentication embedded.
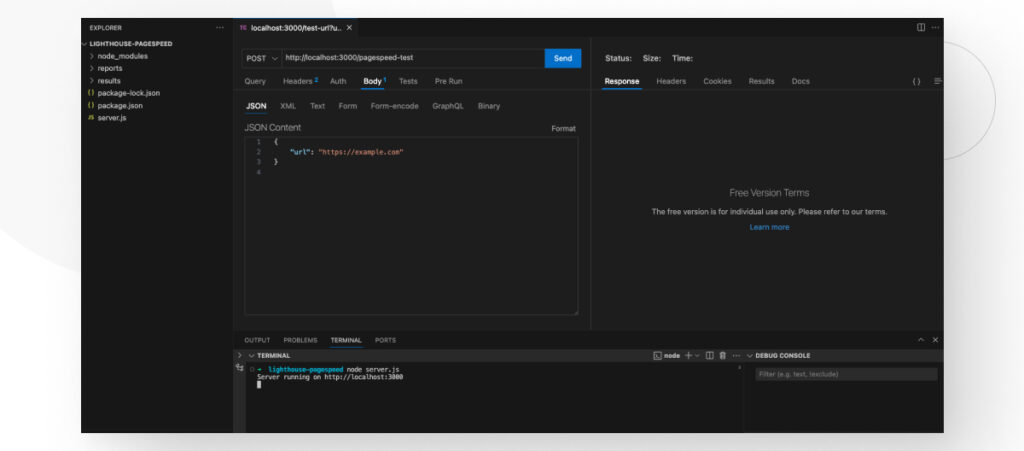
If your site has basic authentication, add the credentials like this https://user:password@example.com.
Revised Description of the Response
After conducting a Lighthouse test through our server setup, the response contains detailed performance results for mobile and desktop configurations and links to the full HTML reports. Here’s what the response includes:
- currentResult. This section contains the latest test results, with a breakdown for both mobile and desktop:
- Mobile and Desktop Scores: For each, the response includes performance, accessibility, best practices, and SEO scores, each scaled to a percentage.
- ReportUrl: Direct links to the HTML reports for mobile and desktop tests.
- history. This part of the response includes a list of previous test results for the same URL, following the same structure as currentResult but excluding the latest test to provide a chronological view of past performances.
Example of the Response
Given the structure described, here is a typical JSON response you might receive after running a test:
{
  "currentResult": {
    "url": "<https://example.com>",
    "timestamp": "2024-04-24T15:46:01.239Z",
    "mobile": {
      "scores": {
        "performance": 99,
        "accessibility": 88,
        "bestPractices": 100,
        "seo": 90
      },
      "reportUrl": "<http://localhost:3000/reports/ac531402-b89e-4bb8-9e07-db3496c3847b_mobile.html>"
    },
    "desktop": {
      "scores": {
        "performance": 100,
        "accessibility": 88,
        "bestPractices": 100,
        "seo": 90
      },
      "reportUrl": "<http://localhost:3000/reports/ac531402-b89e-4bb8-9e07-db3496c3847b_desktop.html>"
    }
  },
  "history": [
    {
      "url": "<https://example.com>",
      "timestamp": "2024-04-24T14:53:54.034Z",
      "mobile": {
        "scores": {
          "performance": 100,
          "accessibility": 88,
          "bestPractices": 100,
          "seo": 90
        },
        "reportUrl": "<http://localhost:3000/reports/55d65b3b-024f-4acd-92f0-e1928ddd3b95_mobile.html>"
      },
      "desktop": {
        "scores": {
          "performance": 100,
          "accessibility": 88,
          "bestPractices": 100,
          "seo": 90
        },
        "reportUrl": "<http://localhost:3000/reports/55d65b3b-024f-4acd-92f0-e1928ddd3b95_desktop.html>"
      }
    },
    {
      "url": "<https://example.com>",
      "timestamp": "2024-04-24T14:55:07.385Z",
      "mobile": {
        "scores": {
          "performance": 100,
          "accessibility": 88,
          "bestPractices": 100,
          "seo": 90
        },
        "reportUrl": "<http://localhost:3000/reports/d1b46f09-3f85-4e7f-98ee-2b2ec0b97afb_mobile.html>"
      },
      "desktop": {
        "scores": {
          "performance": 100,
          "accessibility": 88,
          "bestPractices": 100,
          "seo": 90
        },
        "reportUrl": "<http://localhost:3000/reports/d1b46f09-3f85-4e7f-98ee-2b2ec0b97afb_desktop.html>"
      }
    }
  ]
}
Explanation of the Example
- currentResult: Shows the scores for the most recent test. It provides a detailed breakdown of the performance, accessibility, best practices, and SEO scores for mobile and desktop configurations, along with URLs to their respective HTML reports.
- history: Contains an array of past results for the same URL. Each entry mirrors the structure of currentResult, documenting the evolution of the site’s metrics over time. This is valuable for tracking improvements or regressions after updates or optimizations.
This comprehensive response format allows developers to quickly overview the latest site performance metrics while maintaining a historical record for trend analysis and long-term performance tracking.
Test Performance in Protected Environments With Lighthouse
By leveraging the power of Lighthouse, Node.js, and Express, we can create a robust testing environment to approximate the capabilities of Google’s PageSpeed Insights while offering additional features tailored to the needs of developers working in secured or restricted development environments.
This method enhances your ability to optimize site performance and ensures your testing experience is as close to your live environment as possible.
If you found this post useful, read our blog and developer resources for more insights and guides!
Related Articles